

Key Takeaways
Price History Chart
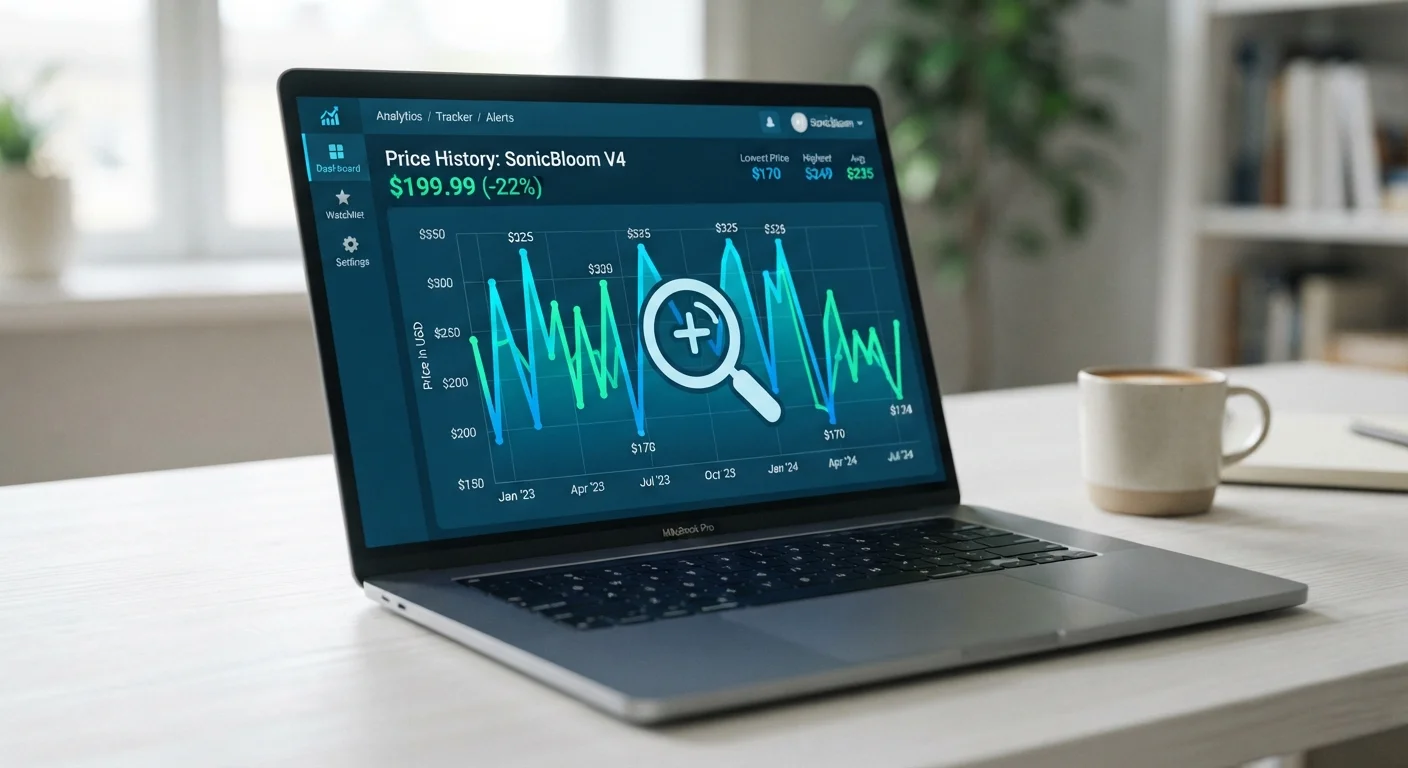
A price history chart is a graph that shows how much a product's price has changed over time - days, weeks, or months - on a given retailer or marketplace. It lets you see at a glance whether the current price is genuinely low or just dressed up to look that way. These charts are generated by price-tracking tools that record the selling price of an item every day and plot that data visually.
Most tracking tools log the "sold by" price at a fixed daily interval, but they may not capture flash sales, lightning deals, or seller-specific variations in marketplace listings like Amazon, where multiple sellers can offer the same ASIN at different prices.
Why Price History Charts Exist - and Why You Need Them
Every time you see a price tag that says 'Was $199, Now $129', you're looking at a number the retailer chose. You have no way of knowing, from that tag alone, whether $199 was ever a real price anyone actually paid - or whether it was set artificially high to make $129 look like a bargain. That's the core problem price history charts solve.
Price tracking tools work by querying product pages at regular intervals - typically once per day - and logging the current price. Over time, those data points form a line graph that tells the real story: where the price started, how often it dips, how long discounts last, and what the product actually sells for on an average Tuesday when no 'sale' banner is running.
Without this data, you're shopping blind. With it, you can answer the only question that matters: Is the price right now better than usual?
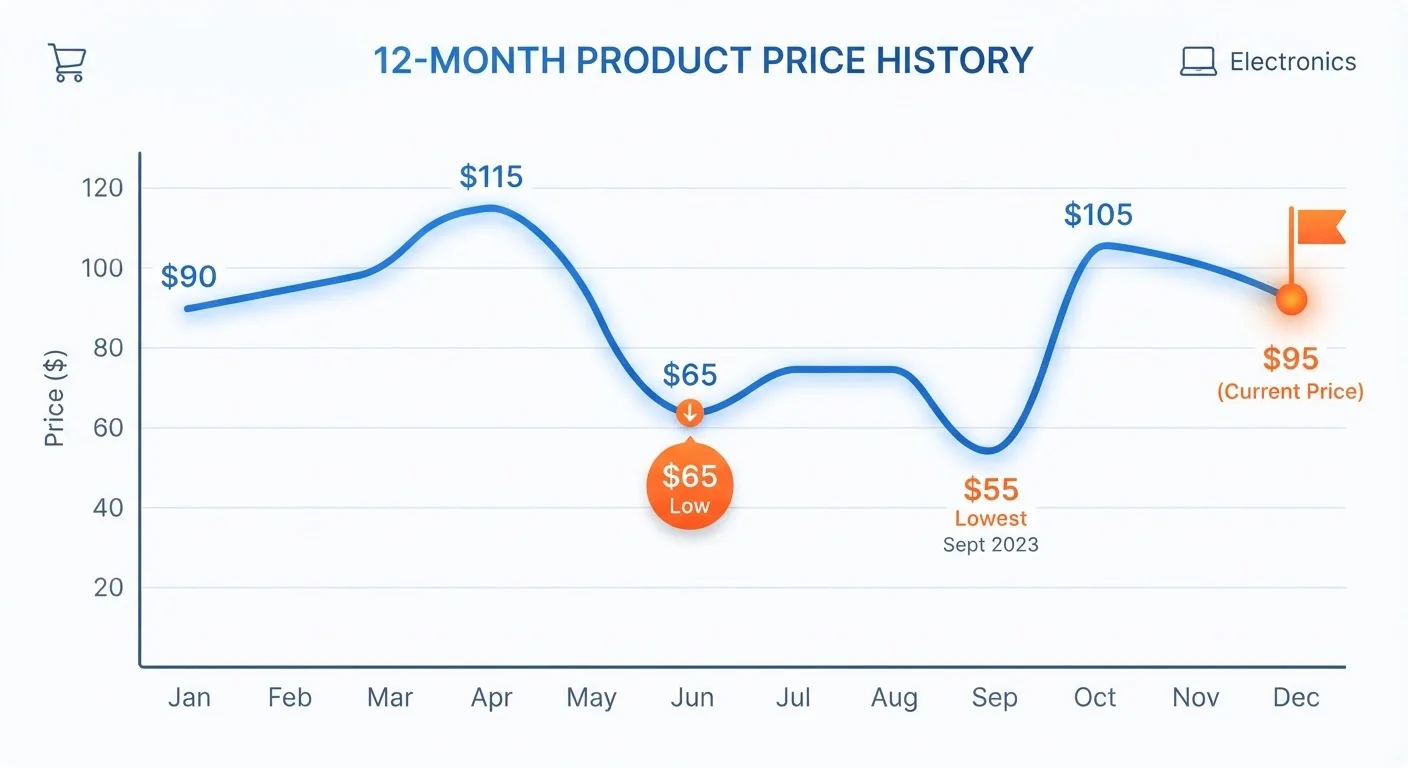
Price history charts are especially critical on marketplaces like Amazon, where prices can change multiple times a day and the displayed 'list price' is often set by the manufacturer - not based on any real transaction. The price tracking apps hub covers the full landscape of tools available, but understanding what the charts are actually showing you is the foundation everything else builds on.
How to Read a Price History Graph
Most price history charts share the same basic layout: time on the horizontal axis, price on the vertical axis, and a line (or series of lines) connecting each recorded price point. Here's what to focus on when you pull one up:
The 90-Day Low vs. the All-Time Low
These are the two most useful benchmarks. The 90-day low tells you what the item has realistically sold for in the recent past - a timeframe relevant to most purchase decisions. The all-time low is the floor: the absolute cheapest this product has ever been recorded. If today's price is at or near the all-time low, it's worth buying. If it's still 20% above that floor, you have room to wait.
Price Plateaus vs. Price Spikes
A long flat section of the chart - where the price held steady for weeks or months - reveals the item's true market price. Short spikes up (often followed by a quick drop back down) frequently correspond to artificial inflation before a sale event. If you see a product that was $90 for three months, jumped to $130 for a week, and is now 'on sale' for $100, you're being charged a 10% premium on what is actually a regular price.
The Drop Pattern
Look at how often and how deeply the price has dropped historically. If a product drops to a certain price point every 6-8 weeks, you can set a price alert and simply wait for the next cycle rather than acting on urgency. Conversely, if the chart shows only one or two significant drops ever, a genuine low is rare and worth acting on quickly.
61%
Amazon products with inflated pre-sale prices
A 2022 analysis by consumer advocacy group Which? found that 61% of Black Friday 'deals' on Amazon were the same price or cheaper at other points during the year.
90 days
Optimal price history window for most decisions
Shopping analysts consistently recommend using the 90-day price range as the primary benchmark, as it reflects current market conditions more accurately than all-time data.
$1,800+
Average annual savings reported by active Honey users
According to PayPal (Honey's parent company), active users who regularly use the Droplist and coupon features save an average of over $1,800 per year across all purchases.
3-5 days
Typical duration of artificial 'original' price inflation
Price monitoring data compiled by CamelCamelCamel community researchers suggests most artificial list-price inflations before sale events last fewer than 7 days.
Understanding these patterns is the first step. The second step is pairing this chart data with a broader knowledge of when retailers tend to cut prices by category - something covered in detail in the retail calendar breakdown.
Spotting Fake Discounts: The Inflation Game
Manufactured discounts are one of the most common tactics in retail, and price history charts expose them directly. Here's how the playbook typically works:
- Set an artificially high 'original' price - often the MSRP, which few people ever actually pay.
- Run that inflated price for a short period - sometimes just long enough to qualify for a 'sale' label under consumer protection guidelines.
- Apply the 'discount' and promote it as a major deal.
The result is a percentage off that looks impressive but brings the price down to something close to - or even above - the product's normal everyday cost. The FTC has challenged this practice, but it remains widespread.
FTC Guidelines on Reference Pricing
The FTC's Guides Against Deceptive Pricing state that a 'former price' used as a reference must be a bona fide price at which the product was offered to the public for a reasonably substantial period of time. In practice, enforcement is limited, and the definition of 'substantial' is vague enough that many inflated reference prices still appear legally. Price history charts give you the factual record the rules were meant to protect you with.
Multi-Seller Listings Can Skew Chart Data
On Amazon, a single product page (ASIN) can have offers from dozens of third-party sellers at different prices. Most tracking tools log the price of the default 'Buy Box' seller - usually Amazon itself or the lowest-priced FBA seller. If the Buy Box switches between sellers, the chart may show a price jump that isn't a true price increase, just a different seller winning the default position. Always note whether the chart distinguishes between 'Amazon' and 'New, third-party' price lines.
The chart doesn't lie. If you pull up the price history and see that the 'original' price only appeared for 3-5 days before the current 'sale' price took effect, you're looking at a manufactured discount. Your real benchmark is the price the item sold at for the longest consecutive stretches over the past 90 days.
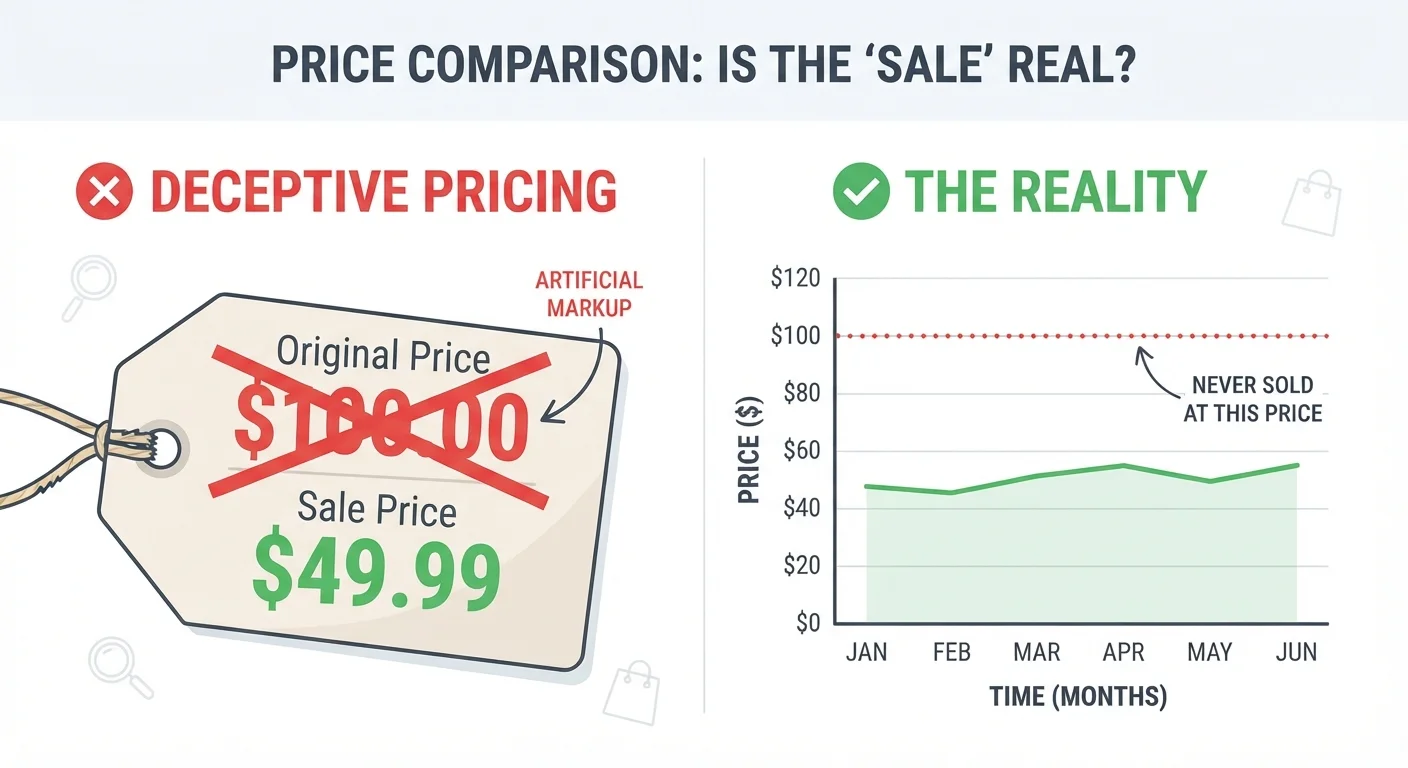
This is particularly common during high-profile sale events. Prime Day, Black Friday, and Cyber Monday are all events where this tactic is widely documented. Cross-referencing product prices with their history during these windows routinely reveals that many 'deals' are anything but. That said, genuine discounts do appear - the chart tells you which is which.
“Retailers are expert at creating the feeling of urgency and value. The antidote is data - specifically, knowing what an item actually costs over time, not just what the store says it used to cost.”
— Edgar Dworsky, Consumer advocate and founder of ConsumerWorld.org
The Best Tools for Price History Tracking
You don't need to be technical to use these tools. Most are browser extensions that activate automatically when you're on a product page - the chart just appears.
CamelCamelCamel (Amazon)
The go-to for Amazon price tracking. Paste any Amazon URL into the CamelCamelCamel website and you'll see a full price history graph going back years. The free price alert system sends you an email when the product hits your target price. It also distinguishes between prices from Amazon directly and prices from third-party sellers - a meaningful difference for both price and reliability.
Keepa (Amazon)
Keepa shows a similar chart but with more data layers, including Amazon sales rank history. If a product's price drops but sales rank also tanks, that could signal a product being discontinued - useful context. The browser extension overlays the chart directly on the Amazon product page so you never have to leave to check.
Honey (Multi-retailer)
Honey's browser extension automatically applies coupon codes at checkout, but it also includes a price history feature called Droplist. You add products to your Droplist and Honey notifies you when prices fall. Coverage spans hundreds of retailers beyond Amazon, which fills a major gap the Amazon-only tools leave.
Google Shopping Price Tracker
When you search for a product on Google Shopping, you'll often see a 'Track price' button. Enabling this sends you Gmail notifications when the price drops across any retailer Google is monitoring for that product. It's a lightweight option that requires no extension installation.
Use Multiple Tools for Cross-Validation
No single price tracking tool covers every retailer or captures every price change. Using CamelCamelCamel for Amazon and Honey for broader multi-retailer coverage gives you meaningful overlap. If both tools show the same price history trend for a product, you can be confident in the data. Discrepancies between tools are worth investigating before making a large purchase.
Set Alerts Below the 90-Day Low
When configuring a price alert, resist the temptation to set it at the current price minus a small percentage. Set your target at or slightly above the 90-day low shown in the chart - this ensures you're only alerted when a genuinely competitive price appears, not just any minor fluctuation. For high-value items, patience pays off far more than acting on marginal drops.
For anyone who buys fitness equipment or outdoor gear at scale, pairing these tools with category-specific timing knowledge pays off significantly. See how fitness gear pricing works and when outdoor gear discounts actually hit for category-level depth.
Setting Price Alerts: Turning Data Into Automatic Savings
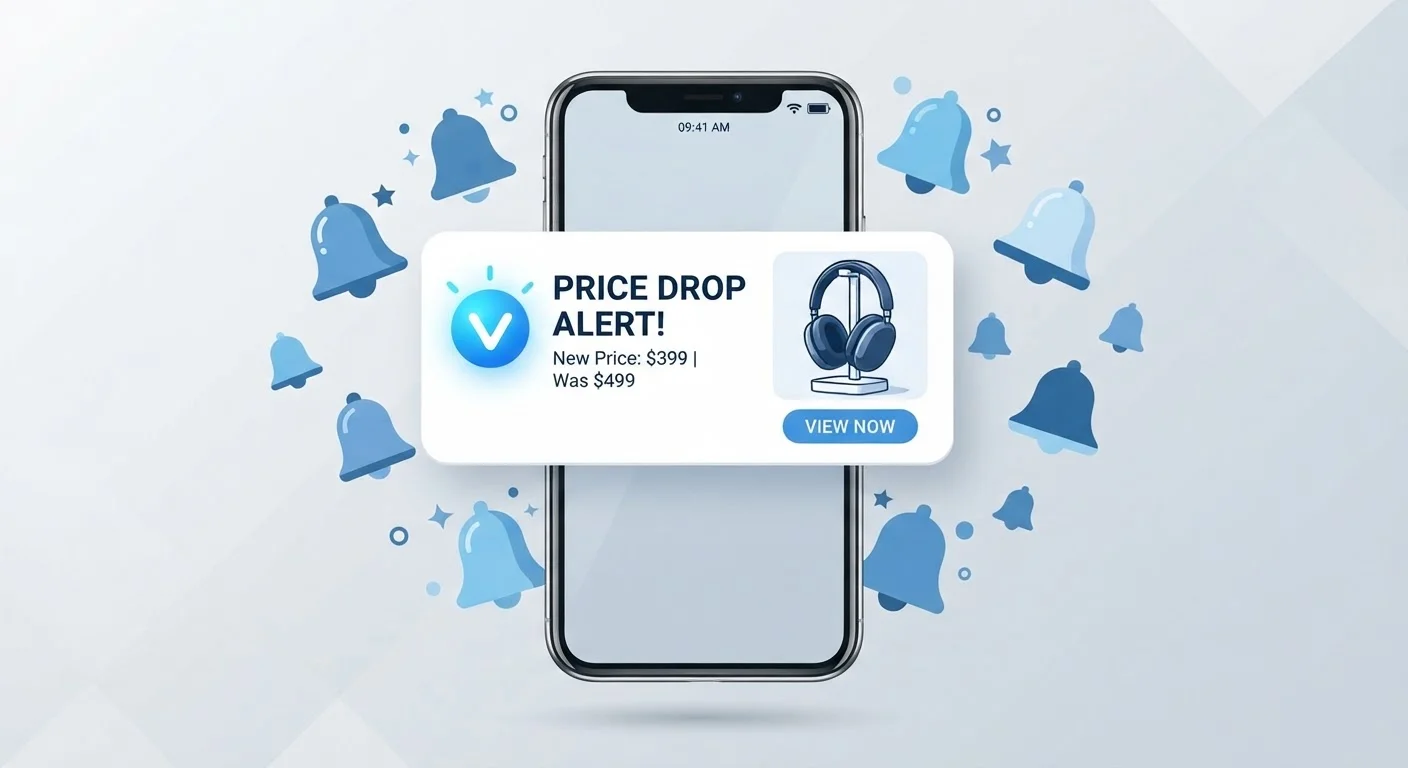
Reading a price history chart is reactive - you look it up when you're already thinking about buying. Price alerts flip this to proactive: you define what you're willing to pay, set the alert, and forget about it until the tool tells you the price has hit your target.
How to Set an Effective Alert
Don't just set your alert at the current price and hope it drops slightly. Use the chart's 90-day low as your target - or the all-time low if you're not in a hurry. This way you're only notified when a genuinely good price appears, not just any small fluctuation downward.
For products you need soon, set the alert slightly above the 90-day low so you're likely to be notified within a realistic timeframe. For non-urgent purchases, the all-time low is worth the wait.
Stacking Alerts With Sale Seasons
Price alerts become even more powerful when you know when retailers typically cut prices in a given category. If historical chart data shows a product tends to dip in January and July, and the retail calendar confirms those are typical clearance windows for that category, you can set alerts in advance of those windows and be first to act when the price drops.
The full mechanics of configuring these alerts across multiple tools is covered in setting up price-drop alerts that actually work - a practical walkthrough worth reading after you understand what the charts are telling you.
What Price History Charts Can't Tell You
Price history data is powerful, but it has real limits you should account for before relying on it completely.
They Don't Capture Every Deal
Flash sales, lightning deals, and short-window promotions often last just hours - sometimes less. Daily price logging misses these entirely. If a product hit an extraordinary low for 45 minutes at 2am, the chart may show no record of it. This is why combining alert tools with deal aggregator communities (like Reddit's r/frugal or Slickdeals) adds a layer of coverage no automated tool provides.
They Reflect Listed Price, Not Final Price
Price history charts show what the retailer listed - not what you'd actually pay after coupons, cashback, credit card rewards, or promo codes. A product might chart at $80, but if a stackable 15% coupon is routinely available, the true floor is closer to $68. Always calculate total cost at checkout, not just the listed price.
Stock and Availability Context Is Missing
A product at its all-time low might be there because it's being discontinued or is significantly overstocked. That's not necessarily bad - clearance prices are real prices - but it does mean you should check whether replacement parts, accessories, or software support will still be available. Keepa's sales rank overlay helps here: a sudden rank improvement alongside a price drop usually means a promotional event; a rank crash alongside a price drop can signal end-of-life.
FTC Guidelines on Reference Pricing
The FTC's Guides Against Deceptive Pricing state that a 'former price' used as a reference must be a bona fide price at which the product was offered to the public for a reasonably substantial period of time. In practice, enforcement is limited, and the definition of 'substantial' is vague enough that many inflated reference prices still appear legally. Price history charts give you the factual record the rules were meant to protect you with.
Multi-Seller Listings Can Skew Chart Data
On Amazon, a single product page (ASIN) can have offers from dozens of third-party sellers at different prices. Most tracking tools log the price of the default 'Buy Box' seller - usually Amazon itself or the lowest-priced FBA seller. If the Buy Box switches between sellers, the chart may show a price jump that isn't a true price increase, just a different seller winning the default position. Always note whether the chart distinguishes between 'Amazon' and 'New, third-party' price lines.
Despite these limitations, price history charts remain the single most reliable tool for validating whether a sale is real. Used alongside dedicated price tracking apps, they eliminate guesswork from the majority of purchase decisions.