
Price-Tracking Tools for Electronics: How They Work and What to Expect
Automated price trackers alert you to drops, but they have real limitations. Learn how these tools function and how to interpret their data.
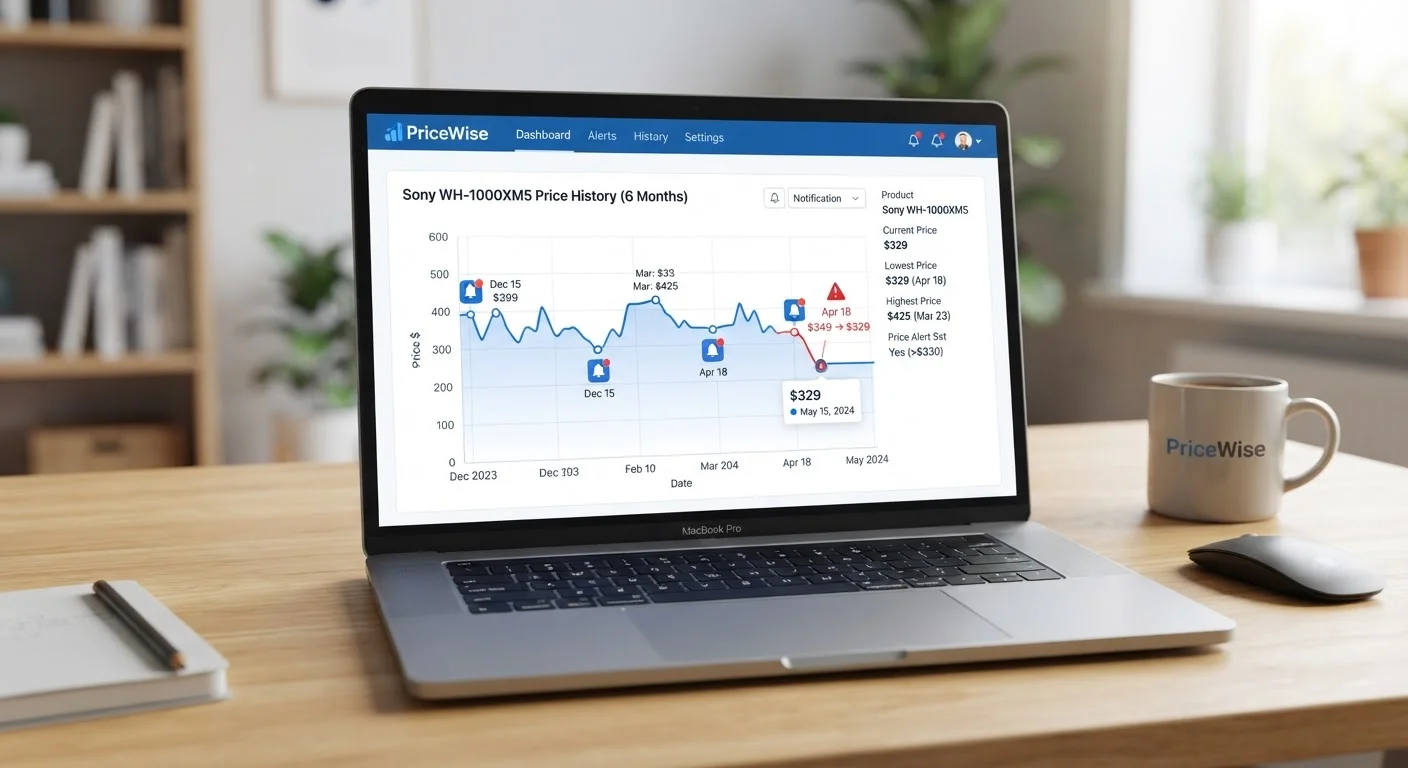
Photo: SaverSteals.com | Explore More. Shop Smarter. editorial
—— In This Article
Key Takeaways
- Price trackers record historical price data, helping you judge whether a current price is genuinely lower than usual.
- Trackers poll pages at intervals, so there is always a small lag between an actual price change and an alert.
- Retailer-specific promotions, seller-fulfilled listings, and bundle pricing are often missed by automated tools.
- A low price in the tracker graph is only meaningful when compared against the full price history, not just the most recent data.
- Understanding why electronics prices change frequently makes tracker data far easier to interpret correctly.
How Price-Tracking Tools Collect and Store Data
Price-tracking tools work by periodically visiting a product's retail page - or querying a retailer's API if one is available - and recording the listed price at that moment. This data point is added to a running log, which over weeks and months builds into a price history graph. The graph is the core value of any tracker: it lets you see whether today's price is unusually low, near the long-run average, or actually higher than it has been recently.
Because most tools poll pages on a schedule (commonly every two to six hours), they capture snapshots rather than a continuous stream. A flash sale that opens and closes within an hour may never appear in the historical record. Similarly, if a retailer changes a price between two polling cycles, the tracker logs only the price it found at its next scheduled check.
For electronics specifically, this lag matters. Electronics prices can shift many times in a single day due to algorithmic repricing, meaning a tracker's record is always slightly behind reality. Understanding that limitation prevents you from treating tracker data as a live price feed.
2-6 hrs
Typical polling interval for price-tracking tools
Most browser extension and web-based trackers check product pages every two to six hours rather than in real time.
~30%
Share of electronics price changes missed by hourly trackers
Industry analyses of dynamic pricing suggest a meaningful share of retail price adjustments on electronics are reversed within the same day, making them difficult for interval-based trackers to capture.
12 months
Recommended price history window for accurate interpretation
Consumer guidance from deal-analysis communities generally recommends reviewing at least 12 months of price data to identify seasonal patterns in electronics pricing.
What Trackers Capture Well - and What They Miss
Price trackers perform reliably when monitoring a single, clearly identified product sold by a retailer's own storefront. In those cases, the product page URL is stable, the seller is consistent, and pricing changes are applied directly to the listed retail price the tool is reading.
Accuracy erodes in several common situations:
- Marketplace sellers: On platforms where a product is sold by multiple third-party sellers, prices listed by different sellers can look like price changes when they are actually seller switches.
- Checkout-only discounts: Coupon codes, loyalty rewards, or promotional credits applied at checkout are invisible to trackers that read only the product listing price.
- Bundle configurations: A product sold as part of a temporary bundle at a lower per-unit cost may not be tracked as a price drop.
- Refurbished listings: Most tools do not track certified refurbished or open-box variants, which are priced and managed separately. Shoppers interested in that channel can explore options through certified refurbished electronics programs.
Verify the Seller Before Acting on a Tracked Price
When a tracker reports a price drop on a marketplace platform, confirm that the seller fulfilling the order is the same one whose price history you've been following. A switch from a retailer's own storefront to a third-party seller can appear as a price change even when the underlying product or service terms differ meaningfully.
How to Interpret a Price History Graph
A price history graph is most useful when you read the full time range, not just the most recent movement. A product shown as 15% below its "original" price looks like a genuine deal - until the graph reveals that the so-called original price existed for only a few days when the item launched, and the current price has been the norm for months.
Practical interpretation points to keep in mind:
- Look at the median, not just the peak: The highest recorded price is often not representative. Focus on where the price has spent most of its time.
- Identify seasonal patterns: Electronics often see price movement around major retail shopping periods. A graph covering 12 months will surface those patterns clearly.
- Cross-reference product release cycles: Prices on prior-generation models frequently drop when newer versions launch. Understanding product release cycles adds important context to what you see in a tracker graph.
- Don't anchor to a single low point: If a price hit a record low once during a short promotional window, it may not return to that level for a long time - or at all.
Setting Alerts and Managing Expectations
Most price-tracking tools allow you to set a target price and receive an email or push notification when that threshold is reached. This shifts shopping from active searching to passive monitoring - a meaningful change in purchasing behavior that passive alert tools have been shown to influence across many product categories.
When setting a target price, calibrate it against the actual history rather than a wishful number. A target set below the product's all-time recorded low will almost certainly never trigger. A target near the product's median historical price has a reasonable probability of alerting you within a few months, depending on how volatile that product's pricing is.
It also helps to set alerts for more than one product. Electronics categories are wide, and a functionally equivalent item from a different model line may reach your target price sooner. Tracking a shortlist rather than a single product gives the tool more surface area to work with.
Finally, when an alert does fire, verify the current price directly on the retailer's page before acting. Trackers can occasionally display stale data if a site's structure changed between polling cycles, and the alert itself represents the price at the last check - not necessarily the price at the moment you read the notification.
Trackers Are a Starting Point, Not a Guarantee
Price-tracking tools surface data that can inform a purchase decision, but they cannot account for every variable - regional pricing, account-specific offers, or last-minute coupon availability among them. Treat tracker output as one input in a broader evaluation, not as a definitive signal that a given price is the lowest you can obtain.
Frequently Asked Questions

Electronics Editorial Team
Electronics Editorial Team is the collective byline for our editorial team and contributor network. Articles published under this byline or an editorial pen name are researched, written, and reviewed according to our editorial standards for clarity, consistency, and independence before publication.
View author profile